Infographics Archive

The Scales

In collaboration with New Space Economy, we present a UAP Visual Archives containing a wide variety of interesting and informative infographics on UAP and the search extraterrestrial life. If you find them helpful or engaging, please share them with others who might enjoy or benefit from the content.  

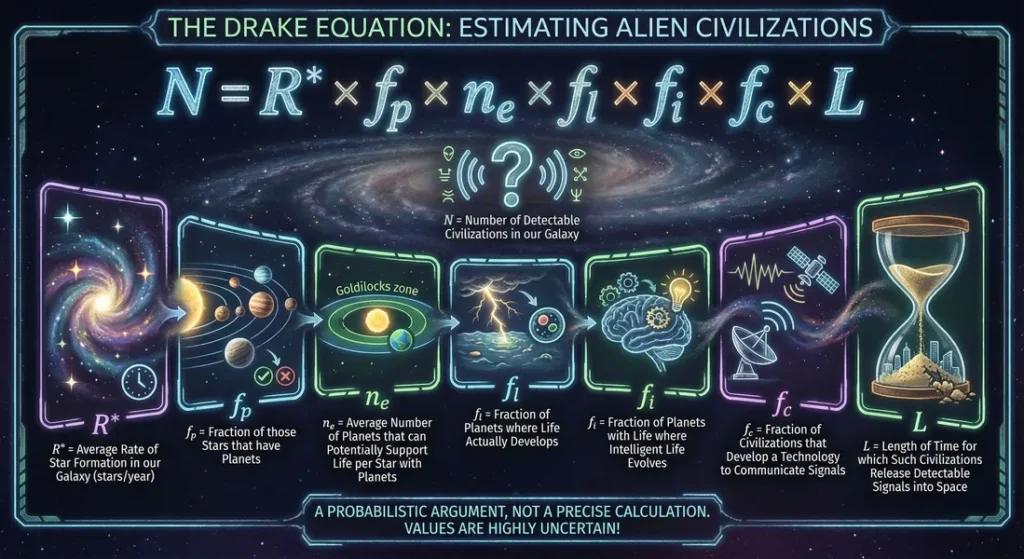
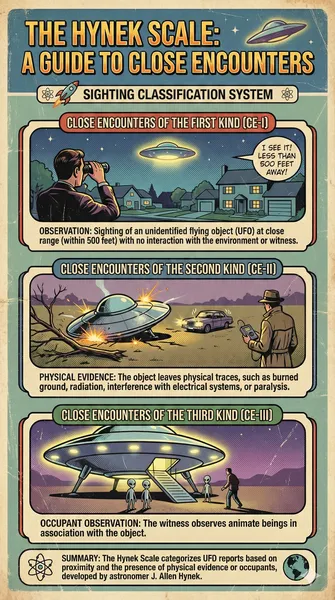
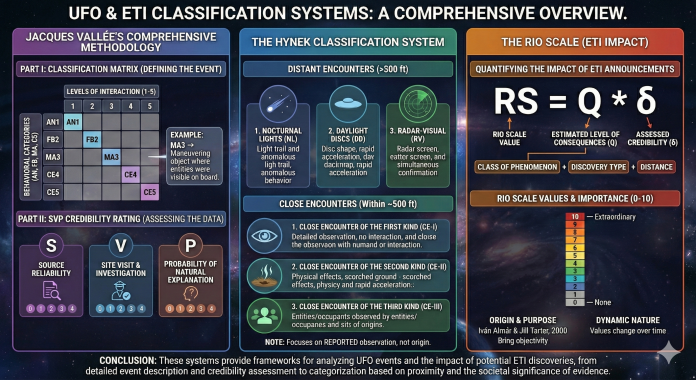
There is an endless assortment of UAP infographics presented in the UAP Visual Archive, covering a wide variety of topics. The search for extraterrestrial life in the universe is covered via infographics on how the search for extraterrestrial life is conducted, what signals are sought, how they are decoded and via number of scales used to measure different aspects of the search.

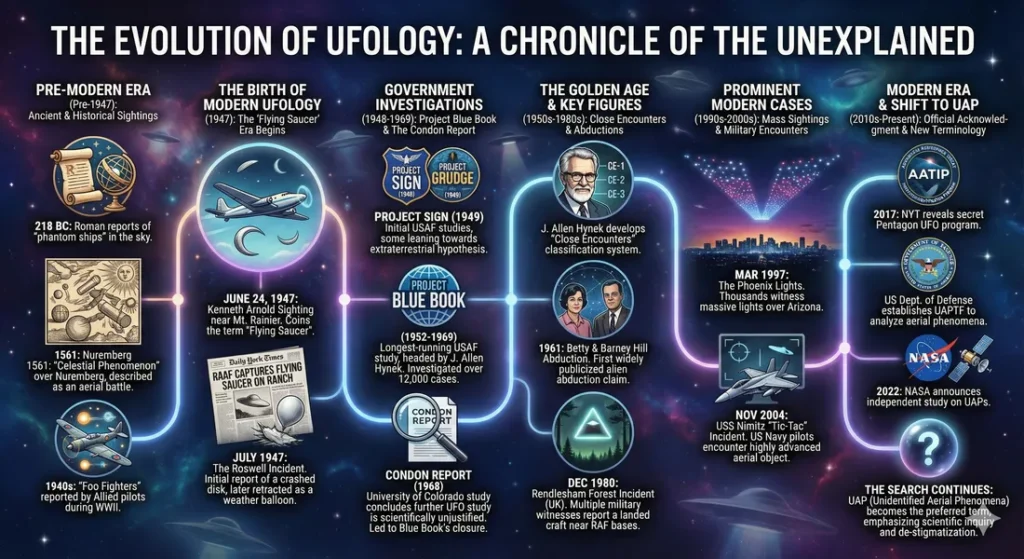
On the UAP front, elements of disclosure are covered from congressional hearings, eyewitness accounts to historic programs. There are also infographics on such diverse topics as catastrophic disclosure, possible propulsion technologies, UAP shapes, The Age of Disclosure documentary, the Sol Foundation and many other topics.

Go ahead and dig in. Infographics are a visually pleasing and thoroughly enjoyable way to expand your knowledge on these topics. 

Vallee Classification System

Infographic outlining Jacque Vallee's classification system for UAP encounters. 5 types of encounters are outlined from Type 1, an anomalous observation to type 5, physical effects on persons or the environment
Click to read about this at New Space Economy

The San Marino Scale

Infographic describing the San Marino Scale, a 0-10 scale quantifying the risk of messaging to an extraterrestrial intelligence, including the factors increasing the risk score and potential consequences of ET contact
Click to read about this at New Space Economy

The Rio Scale

Infographic describing the RIO Scale for quantifying the significance of alien contact claims
Click to read about this at New Space Economy

The London Scale

Infographic describing the London Scale, a method for quantifying claims of extraterrestrail life
Click to read about this at New Space Economy

The Kardeshiv Scale

Infographic describing the Kardashev Scale, which measures civilations by energy consumption. Describes the 4 types of civilations from type 0 to type 3, each with a level of energy consumption orders of magnitude greater than the last
Click to read about this at New Space Economy

The Drake Equation

Infographic describing the purpose of and variables used in the Drake Equation, an equation for estimating the number of alien civilizations in the universe
Click to read about this at New Space Economy

SETI First Contact

Infographic outlining the five stages of SETI's first contact protocol
Click to read about this at New Space Economy

NHI Origination Hypotheses

Infographic outlining 4 possible ways that non-human intelligences might have come into existence
Click to read about this at New Space Economy

Hynek Classification System

Infographic outlining J. Allen Hynek's Sighting Classification System. The three tier system outlines progressively closer encounters with UAP
Click to read about this at New Space Economy

Definition of Ufology

Infographic of a timeline of the evolution of ufology. Describes 6 eras of ufology with key events that changed ufology
Click to read about this at New Space Economy

Classification Metrics for ETI and UAP

Infographic describing three scales for evaluating extraterrestrial contact and impact. The thre scales covered are the Vallee methodology, the Hynek classification system and The Rio scale
Click to read about this at New Space Economy